
Validation Methods
Stuck is a measurement problem: 3 pre-build signals that actually work
A sentence on r/Entrepreneur last weekend rearranged the whole problem: "most people aren't stuck because they're too early, they're stuck because they're not getting real signal." The standard advice for a stuck founder ("ship faster," "pick a niche," "just commit") assumes momentum is the blocker. It usually isn't.
I've been tracking that exact thread. The OP had five candidate ideas and no way to rank them. Every piece of feedback they'd collected landed with the same weight, because a founder's head isn't a measurement instrument. Ten concepts score identically up there when you've got no protocol to separate them. CB Insights data from 2024 shows 43% of failed VC-backed startups cited poor product-market fit as the reason. That's a measurement failure upstream of the build.
Below are three pre-build signals you can actually read, how each one works, and how to collect all three in a weekend. For the broader menu of when to use which method, see which method when.
Key Takeaways
- Stuck isn't a momentum problem. It's a measurement problem.
- Three pre-build signals replace intuition: purchase intent by segment, price sensitivity per concept, and an objection taxonomy from target users.
- Nielsen BASES data across 200,000+ initiatives shows optimized concepts generate 38% more revenue and are 4x more likely to succeed.
- All three signals can be collected in a weekend using synthetic-first triage followed by recruited-segment interviews.
- Synthetic panels are useful for triage, not final answers. Interviews and A/B tests still matter downstream.
Why stuck is usually a measurement problem, not a momentum problem
Stuckness lingers because every option looks equivalent when your measurement instrument is intuition. A 2015 meta-analysis of 99 studies (Chernev, Bockenholt, Goodman, Journal of Consumer Psychology, 2015) found choice overload has strong negative effects on decision quality specifically when the choice set lacks a dominant option or clear decision criteria. That's the founder state.
"Ship faster" is the wrong prescription for that diagnosis. If five ideas already feel roughly equal, adding a sixth makes things worse. You don't need another concept. You need a ruler.
The cost of skipping measurement is concrete. Nielsen BASES benchmarks show 48% of innovations fail to grow by Year 2 because Product, Concept, Price, Pack, and Promotion weren't tested together pre-launch. Pendo's 2019 Feature Adoption Report shows roughly 40% of product features go unused. As an illustrative estimate, a 3-engineer plus 1-PM team at indie-hacker salaries burns roughly $40K to $50K on a 3-month feature before launch. That's the bill for skipping the ruler.
The alternative: pick signals you can actually read, and commit to reading them before you commit to building. Three of them, below.
Citation capsule: A 99-study meta-analysis in the Journal of Consumer Psychology (Chernev et al., 2015) found choice overload strongly degrades decision quality when the option set lacks a dominant choice. Founders with 5+ equivalent-feeling concepts are in exactly that state, and adding a sixth concept makes the decision harder, not easier.
Signal #1: purchase intent scored by segment, not pooled
A pooled intent score hides the signal. A concept that averages 3.2 across your full audience can mask a segment scoring 4.1 and another scoring 2.1. Floh et al.'s segmentation research in the Journal of Business Research (2014) shows that pooled analysis can hide heterogeneity across customer groups. Pre-launch concepts always sit in the high-heterogeneity zone.
Founder-averaged intuition does the same pooling instinctively. You talk to 20 people, average the vibes, call it a signal. But the decision you're trying to make isn't "is this concept good overall." It's "which segment should I build for first?" A pooled score can't answer that. A segment-level score can.
How to measure intent cheaply and reliably
Use the Juster 11-point purchase-probability scale, not a 5-point Likert. A Juster bibliography meta-review across 40 independent studies reported a correlation of around 0.97 with actual purchase behavior on durables, FMCG, and services. That's an unusually strong predictor for stated-intent research. The full protocol is in Juster vs Likert for purchase intent.
On the synthetic side, a 2025 PyMC Labs + Colgate-Palmolive study (arXiv 2510.08338) showed LLM synthetic consumers hit 90% correlation attainment versus human test-retest reliability on purchase intent (n=9,300 humans, 57 personal-care product surveys). That's why pre-build scoring gets cheap at weekend-scale. The caveat stays honest: contrasting 2024-25 work from Cambridge Political Analysis shows synthetic panels compress variance and underperform on attitudinal data. Synthetic is useful for triage, not final answers. For more on where that line sits, see synthetic panels for pre-build triage.
Citation capsule: The Juster 11-point purchase-probability scale correlates around 0.97 with actual purchase behavior across a 40-study bibliography, and PyMC Labs + Colgate-Palmolive (arXiv 2510.08338, October 2025) reported 90% correlation attainment for LLM synthetic consumers versus human test-retest reliability on 57 personal-care surveys with 9,300 humans.
Signal #2: price sensitivity per concept
Only 6% of startup founders believe their pricing aligns with product value, per a First Round Capital survey cited by Kyle Poyar and OpenView Partners in 2023-24. Underpricing is roughly twice as common as overpricing. Pre-build price sensitivity testing is how you avoid landing in the 94% by default.
Why is founder-intuited price usually wrong? You anchor on what you'd pay. Your target segment has different reference prices, different substitutes, and a different relationship with the category. "I'll figure pricing out later" is the most expensive deferred decision in the indie-hacker playbook. OpenView's SaaS Pricing Resource Guide benchmarks show a 1% pricing improvement yields an 11.1% increase in operating profit, outpacing cost, volume, or fixed-cost improvements.
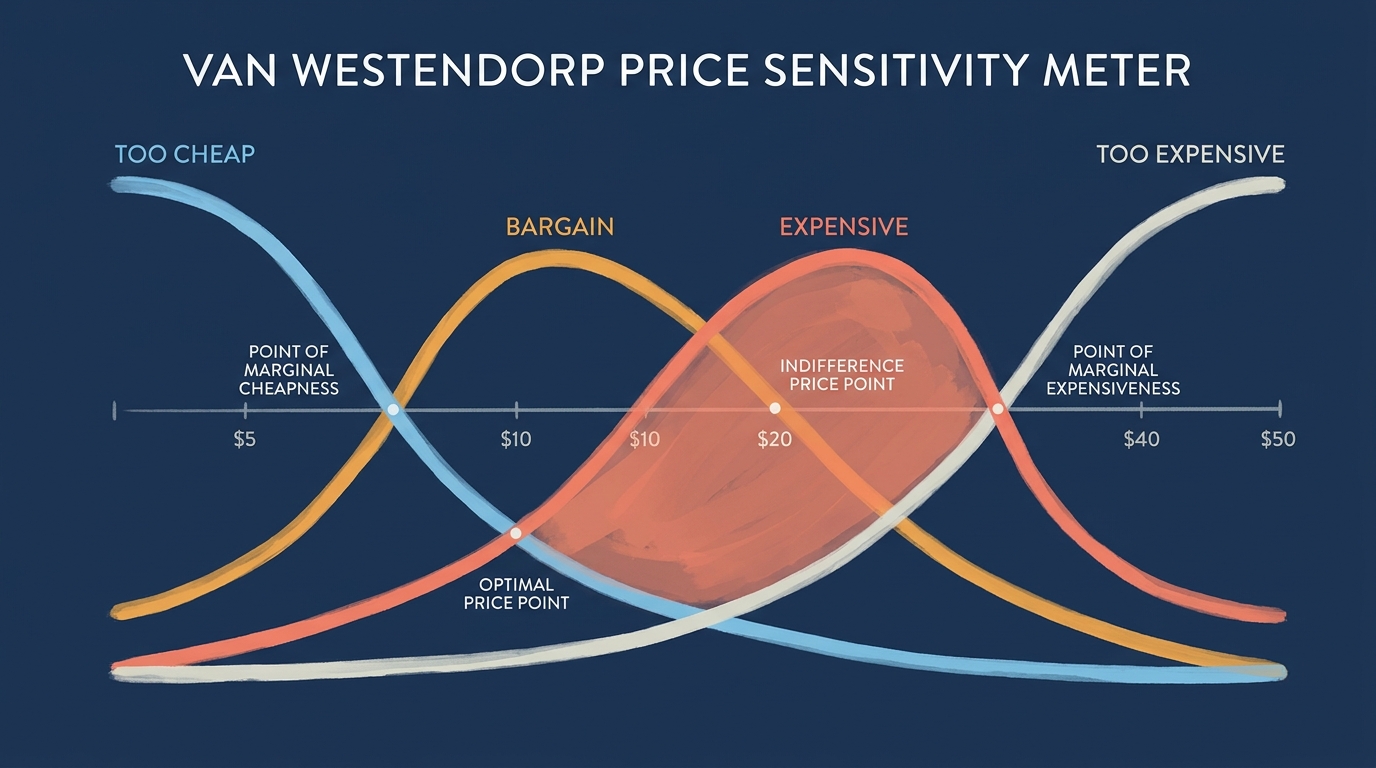
Van Westendorp in practice
Run a Van Westendorp Price Sensitivity Meter (PSM) for each concept. You ask four questions: at what price is the product so cheap you'd question quality, a bargain, getting expensive, and so expensive you wouldn't buy? The intersection of the "bargain" and "expensive" curves is your price range.
PSM vs incentive-aligned Becker-DeGroot-Marschak willingness-to-pay auction comparisons (Van Westendorp PSM vs incentive-aligned BDM comparisons, 2016) have shown respondents tend to underestimate their upper price threshold. Use the PSM to find a plausible range, add 10% to 15% to the upper bound as a sanity check, then cross-reference against comparable products in the category.
Citation capsule: A First Round Capital survey reported by OpenView Partners in 2023-24 found only 6% of startup founders believe their pricing aligns with product value, and OpenView's SaaS Pricing Resource Guide shows a 1% pricing improvement yields 11.1% more operating profit, outpacing cost, volume, or fixed-cost improvements.
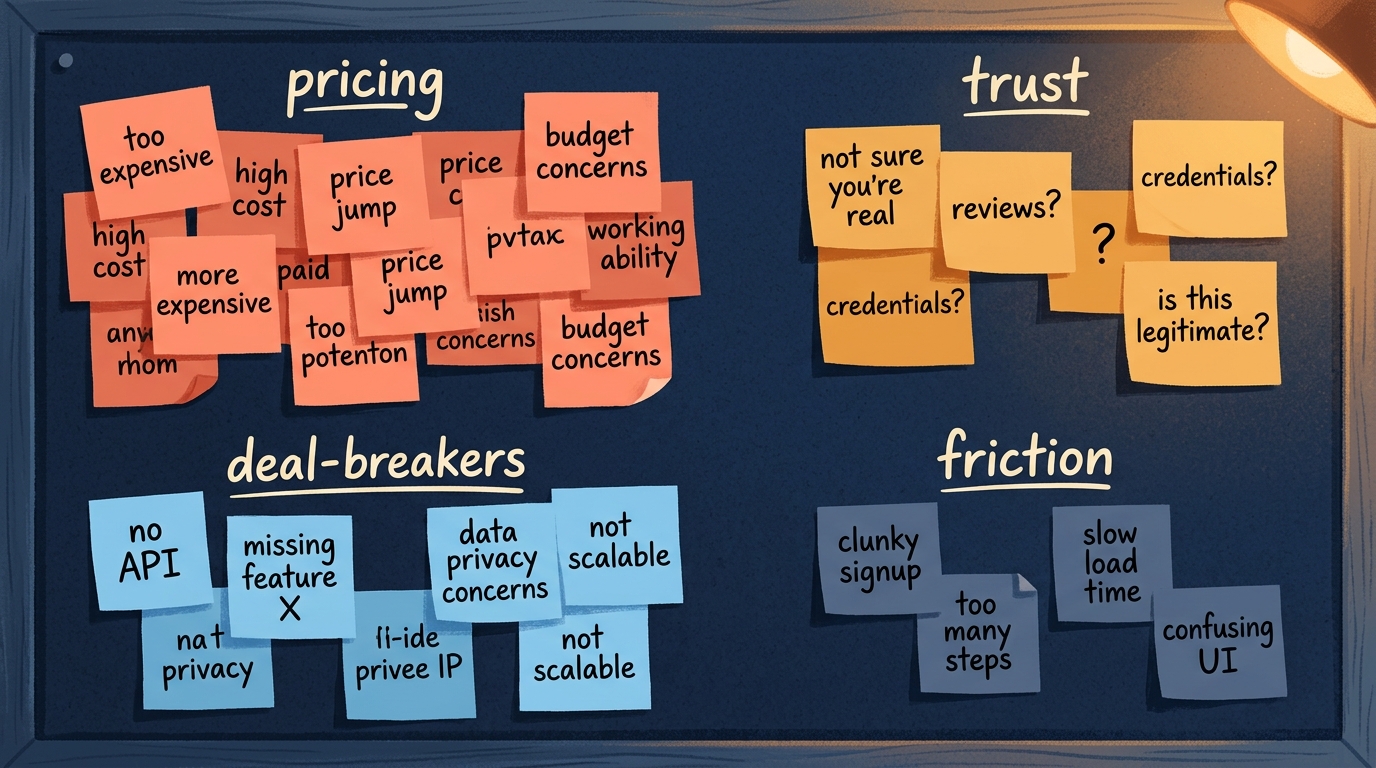
Signal #3: an objection taxonomy from target users
An objection taxonomy is the list of specific reasons people give for not buying, bucketed and weighted. It predicts post-launch churn. A 2021 University of Manchester thesis on text-mining Voice of the Customer data found objections bucket cleanly by effect size: pricing complaints, dishonesty and trust issues, and catastrophic-failure objections exert the largest impact on churn intention.
"We'll learn this from users later" is a 6-to-12-month delay that costs more than a weekend of pre-build interviews. What you want to capture isn't a single-number score. You want prose: the specific sentence structures ("I'd use it but...", "I already have..."), how often each objection shows up per segment, and how severe it is.
How to collect and categorize objections
Write 20 to 40 open-ended prompts for your target segment. A few examples: "what would stop you from buying this?", "what would you use instead?", "what's missing before you'd pay $X?". Run the prompts twice. First through a synthetic panel to generate a broad objection set quickly, then through 3 to 5 recruited humans to confirm which objections are real and which are noise.
Categorize afterward, grouping by root cause rather than surface wording. Three objections that all reduce to "I don't trust the claim" belong in one bucket, even if the phrasing differs. Rank the buckets by frequency multiplied by severity. The top three are your first post-launch roadmap items.
Citation capsule: A 2021 University of Manchester thesis text-mining Voice of the Customer data found objections bucket cleanly by effect size, with pricing complaints, trust issues, and catastrophic-failure objections exerting the largest effect on churn intention, which is why pre-launch objection taxonomies predict post-launch retention.
How to collect all three signals in a weekend
The working protocol. Friday evening, write 3 to 5 concept variants and pick 2 to 3 audience segments (1 to 2 hours). Saturday, run intent scores, price sensitivity, and objection prompts through a synthetic panel against each variant-by-segment combination (4 to 6 hours, $5 to $100 per run). Sunday, sort by intent-by-segment winner and interview 3 to 5 real humans in the winning segment to confirm (Sunday afternoon plus Monday morning, $100 to $300 for recruiting).
Why is this cheap relative to the alternative? Nielsen BASES data across 40+ years of concept testing outcomes shows optimized concepts generate 38% more revenue and are 4x more likely to succeed. That's not a synthetic claim. It's 40+ years of CPG concept-testing outcomes. The weekend protocol compresses the same BASES logic into indie-hacker-scale economics.
Keep the caveat visible. This gives you triage. It doesn't replace interviews or A/B testing. Cambridge Political Analysis published peer-reviewed warnings in 2024-25 that LLM synthetic panels compress variance. Use them for "is this concept alive or dead" decisions, not for "what's the exact conversion rate." For the ordered procedure around the weekend, see the full product validation procedure.
Citation capsule: Nielsen BASES benchmarks from 40+ years of concept testing outcomes show pre-launch optimized concepts generate 38% more revenue and are 4x more likely to succeed than unoptimized ones. Synthetic-first, interview-second triage compresses that logic into a weekend timeline accessible to small teams.
How to decide with the data
Low intent across all segments means the concept is dead. High intent in one reachable segment means interview there. High intent across multiple segments means build a landing page and A/B test headline and pricing before you commit to the feature list. That's the decision tree.
Two failure modes are worth naming. The first is over-indexing on one segment's high score without confirming you can actually reach that segment cheaply. A 4.1 in a segment you can't buy traffic into is a 0. The second is under-indexing on a moderate cross-segment signal because it "doesn't feel dominant." The Juster scale's 11-point granularity exists precisely so you can see small-but-real signal above noise.
What to ignore
Ignore the average score on its own. Ignore overall NPS. Ignore anything that hides segment variance, and anything that collapses the objection taxonomy into a single number. Those metrics feel rigorous because they have decimal points. They're not.
When to stop measuring
Stop when you've answered three questions. Which segment? Which price? Which top three objections will you address in your first 6 weeks post-launch? Once you've got those answers, more panel runs are procrastination. The cost of delay now exceeds the cost of being wrong.
For a related failure mode (mistaking a waitlist for demand), read waitlist is not demand. It's the companion piece to this one.
Citation capsule: Segment-level decision rules outperform pooled averages because Floh et al. (Journal of Business Research, 2014) showed that pooled analysis can hide heterogeneity across customer groups, and the Juster scale's 11-point granularity (r ~ 0.97 with actual purchases) preserves segment-level signal that 5-point Likert scales collapse.
Frequently asked questions
How do I know if my stuckness is a measurement problem or an execution problem?
If you've got 3 or more candidate ideas that feel equivalent, it's measurement. If you've got one idea and can't get it out the door, it's execution. Most founders who say they're "stuck" are in the first camp. Chernev et al. (2015) showed choice overload degrades decisions specifically when no option dominates. That's measurement.
What's the difference between Juster and Likert purchase intent scales?
The Juster scale uses 11 verbal-anchored probability points, from "certain, practically sure" down to "no chance, almost no chance." A 40-study bibliography meta-review found correlation of around 0.97 with actual purchase behavior. A 5-point Likert compresses that granularity. You lose the small-but-real signal that separates "maybe" from "probably."
Isn't Van Westendorp outdated?
Van Westendorp PSM vs incentive-aligned Becker-DeGroot-Marschak auction comparisons (2016) show respondents tend to underestimate their upper price threshold. Not perfect, but still the cheapest reliable pre-build price protocol. Add 10% to 15% to the upper bound and cross-reference against comparable products.
Can AI synthetic panels replace recruited research?
No. PyMC Labs and Colgate-Palmolive (arXiv 2510.08338, 2025) showed 90% correlation attainment on purchase intent in a controlled comparison, but peer-reviewed critiques from Cambridge Political Analysis show variance compression. Synthetic is useful for upstream triage. Interviews and A/B tests still matter downstream. Treat synthetic as filter one, not filter final.
Conclusion
Stuck isn't a momentum problem. It's a measurement problem. The three pre-build signals that separate equivalent-feeling concepts are purchase intent by segment, price sensitivity per concept, and an objection taxonomy from target users. Each one has a peer-reviewed method behind it, can be collected in a weekend, and beats intuition.
The return on that weekend is concrete. Nielsen BASES shows tested concepts are 4x more likely to succeed. If you're staring at five equivalent-feeling concepts right now, the answer isn't to add a sixth. It's to pick a ruler and measure what you've got.
If you want to run the synthetic-triage step this weekend (intent by segment, price read, objection prompts), that's what will.it.sell does. Either way, the ruler matters more than the brand of ruler.
Gregor The Builder is shipping will.it.sell, a pre-revenue B2C synthetic consumer research tool for small teams who need to kill bad concepts before build-time.
Stop guessing. Start knowing.
Your first product validation is free. Get your report in minutes.
Test Your Product Idea Free